The optimal guide to Google Analytics
Marketing
Posted 29 Jul 2020
Website operators know this: You want to offer users value, inform them but not bore them. To entertain your audience with graphics is important, but do not lose your key message in the process. How do you find the right way and which elements of the website are effective? This is where Google provides a helpful tool in form of Google Analytics. It tracks the entire behavior of users on websites and breaks it down into several sub-categories. The knowledge about users and customers helps to optimize the website and shows which keywords spark interest and ensure that they stay on the website. Interestingly, Google Analytics is aimed at both experts and beginners, and a gradual learning progress is achieved with each newly discovered field.
In the search for the right keywords, data-driven PR is the right tool – learn more here.
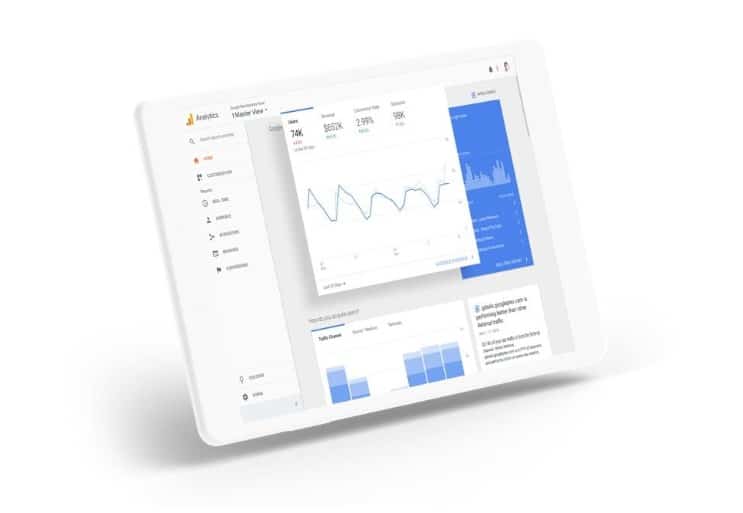
The home menu contains the dashboard with a central overview of the user behaviors on the website. The size and position of the tiles and which information is displayed can be changed at will. This means that the first glance when calling up Google Analytics is always directed at the most important statistics. In addition, Google offers ‘Insights’ – a short text summary about the performance and user behavior of a website compared to previous periods. On the left side of Google Analytics, the data is broken down into ‘Reports’ with different angles.

Figure 1: Dashboard in home menu, source
Under ‘Target group’, all users are analyzed according to different criteria, e.g. geographic data (origin and language) and whether mobile devices or desktop are used during the visit. In addition, settings for your own target group can be defined.
Important aspects are
Nowadays, companies present themselves on various media channels. Besides the obligatory web presence, social media channels are necessary to keep users informed about news and eventually lead them to the website. There are also other acquisition opportunities, such as e-mail newsletters and optimizing search engine ranking via SEO. Google Analytics provides information about which channels users use to reach the website and which marketing measures are particularly successful.
After clarifying how users get to the website, it is necessary to analyze the users’ behavior on the website. An important indicator of behavior is the bounce rate – it indicates the page on which the user leaves the website. Google rewards a low rate with a higher ranking in its search engine rankings. Interesting content, links between pages and the associated optimization of the website architecture help to reduce the bounce rate.
As a digital marketing expert, you come into contact with various Google tools. Google Ads and the Search Console can be integrated into Google Analytics like many others and can be centrally managed. This saves many clicks and monitoring is simplified by the reporting function of Google Analytics.
Should the features of Google Analytics no longer suffice at some point, Analytics 360 is a useful addition. This premium version is activated by the Google sales team and is individually tailored to each company. In addition to a deeper range of analysis data, even more specific add-ons can be integrated here.
In the further work with Google Analytics, you learn a lot about the visitors of a website and the website itself. Using the export function, reports can be compared over several time periods and conclusions can be drawn about changes in performance. But for many, this is where the work with Google Analytics ends. For experts, it is now necessary to deduce recommendations for content and changes to the website from the basic data. They have to fine-tune keywords and learn more about their own website by constantly monitoring user behavior.
Are you interested in a cooperation with marketing experts? Contact us!